Comparison of model results with lab data
The comparison between the measured data provided by the laboratory experiment for the Mero River and the corresponding HySEA model simulation are shown here. The sections where measured data were obtained are shown in Figure 1. The comparison for the longitudinal section after 10 hours of simulation is presented in Figure 2 and the comparison at the 9 transversal sections is shown in Figure 3.
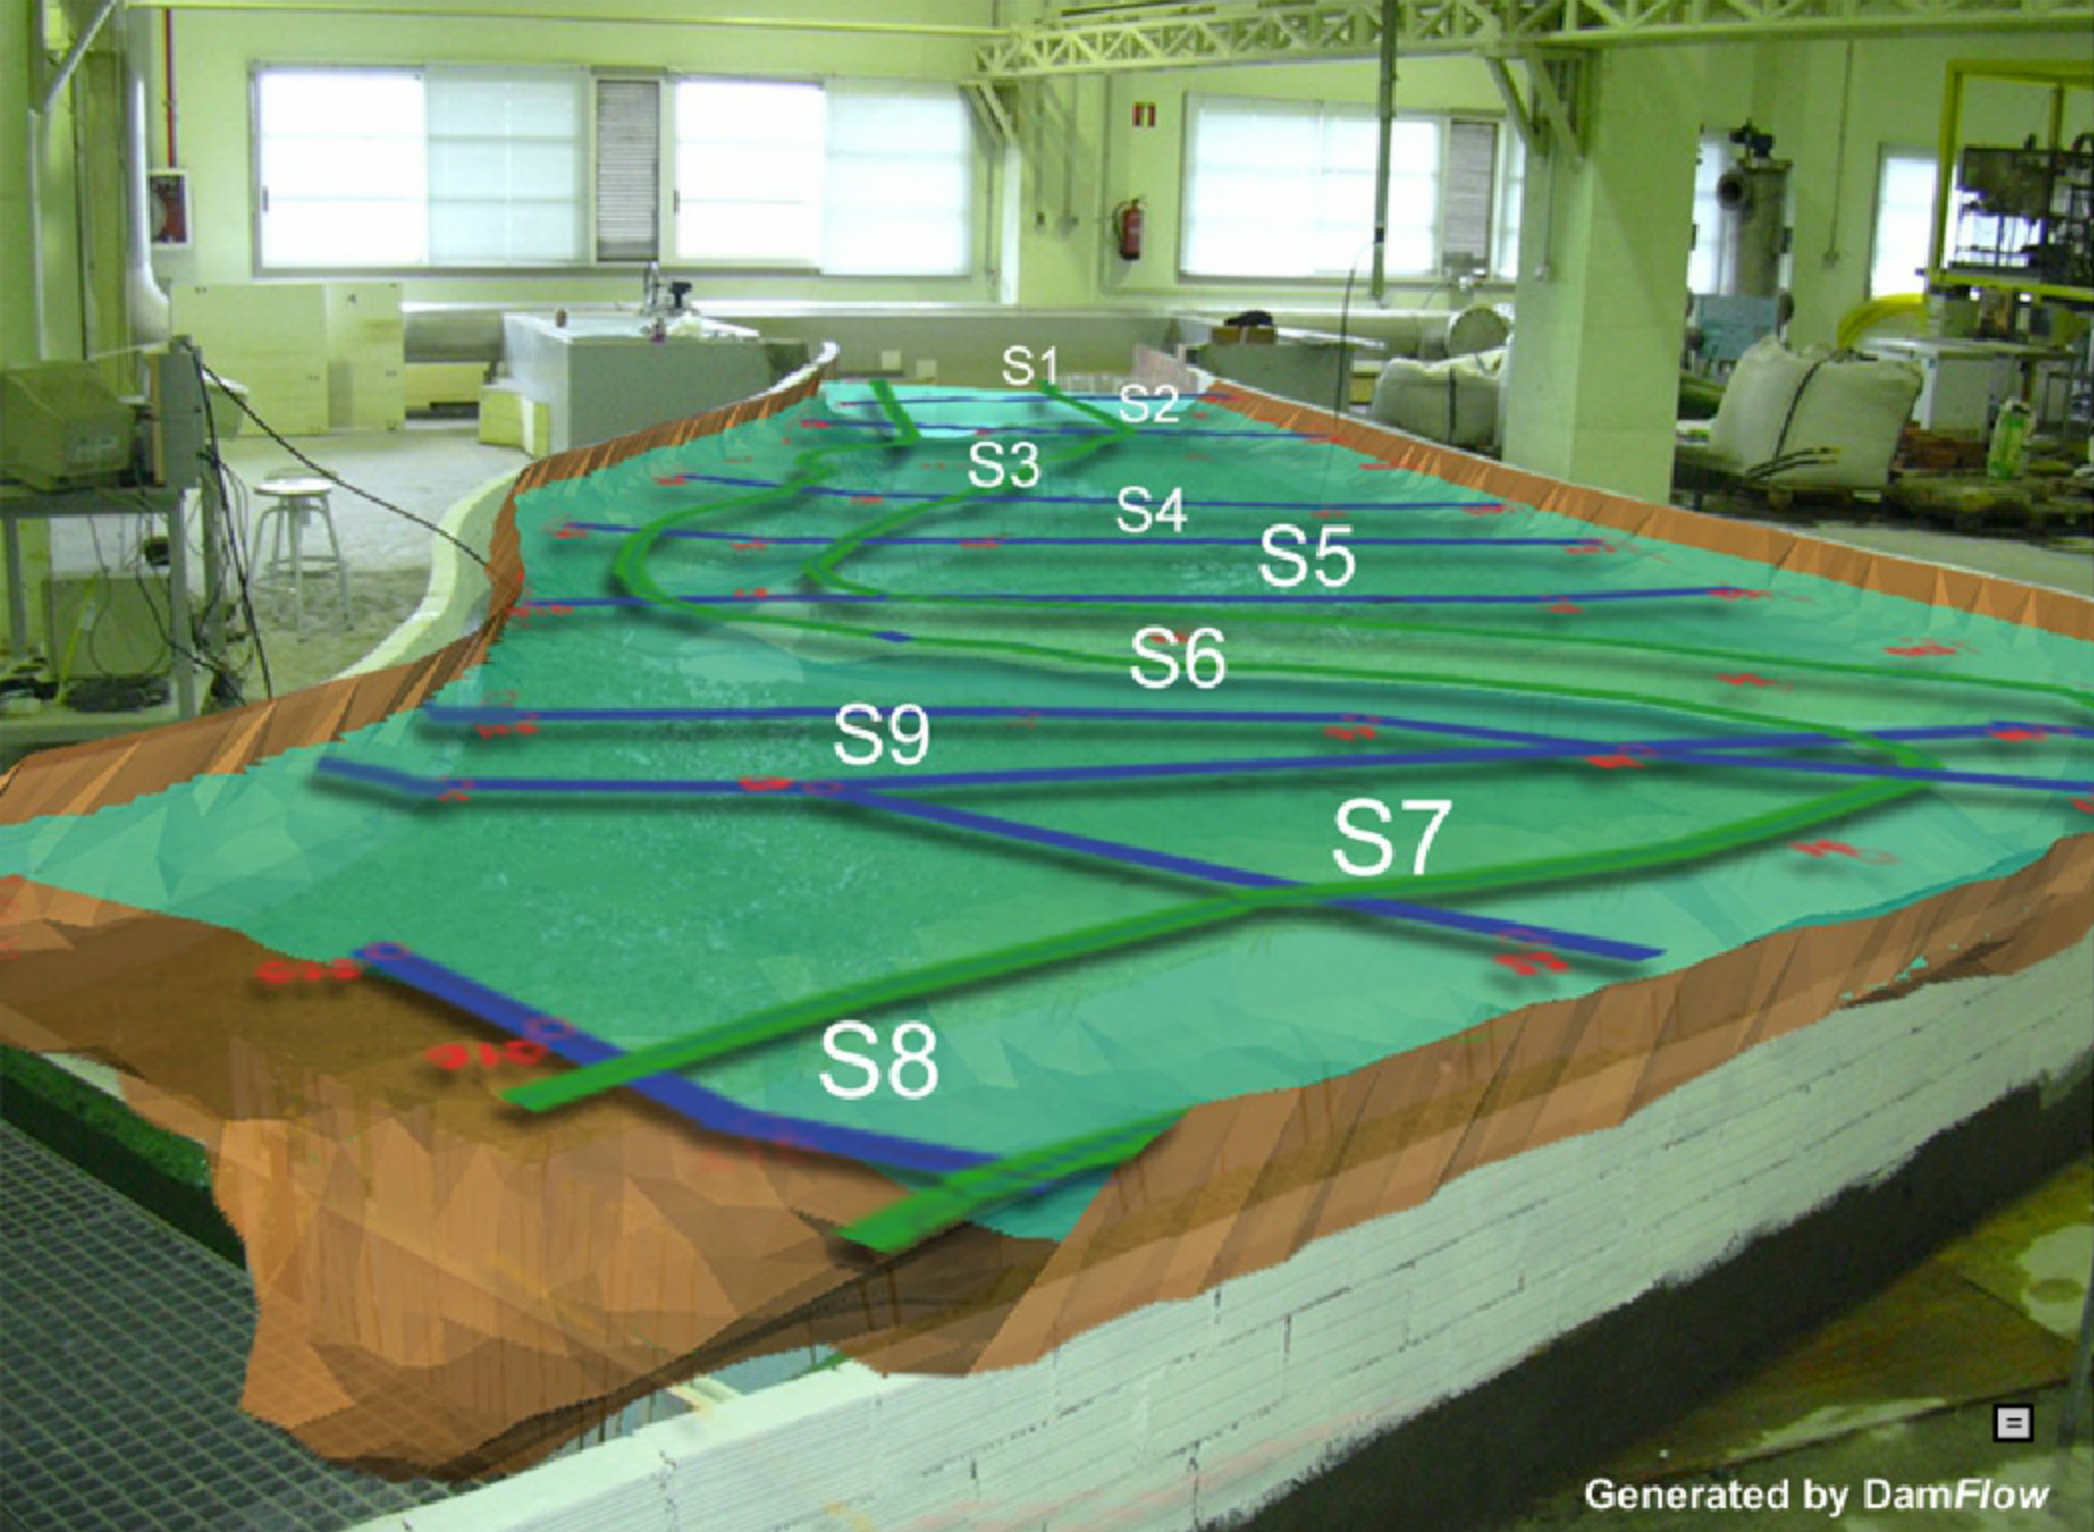
Figure 1. Sections where measured data were taken in the laboratory experiment.
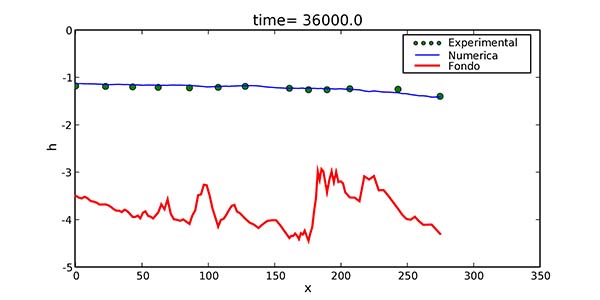
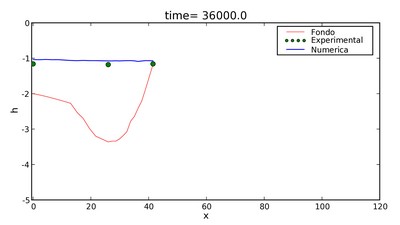
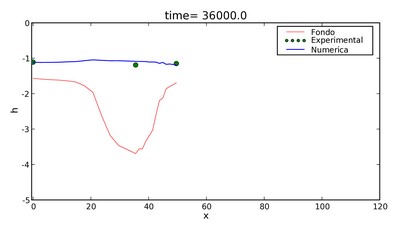
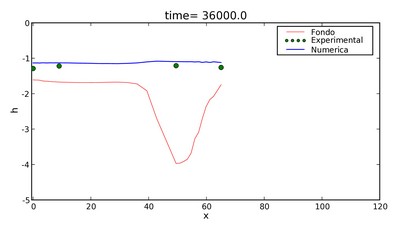
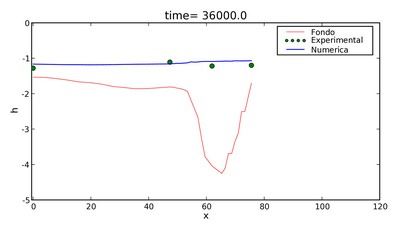
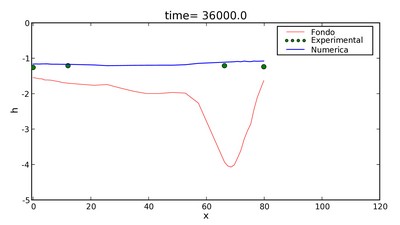
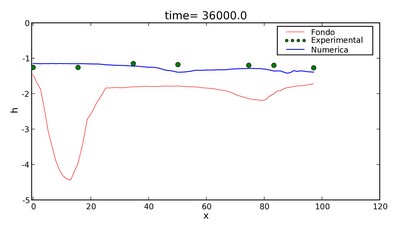
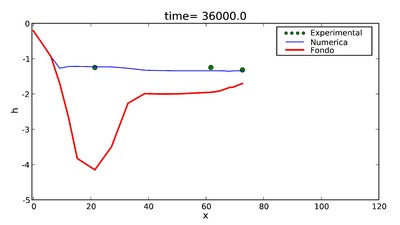
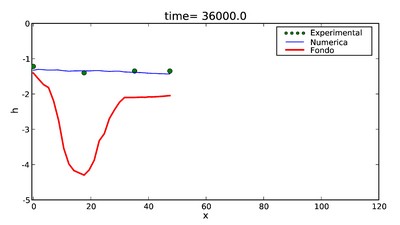
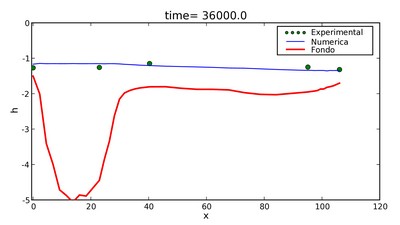
Figure 3. Several cross-section (from 1 to 9 as marked in Figure 1) along the model river basin. In red the river botton topography, dots for the measured laboratorydata and in blue the model water height at time t=36,000 seconds, i.e., after 10 minutes of physical time evolution.


